Insights
Your glucose trends, in the numbers your clinic uses
Time in Range, estimated A1c, variability, and average glucose, calculated from your own readings and explained in plain language. Part of Glynce Plus.
Download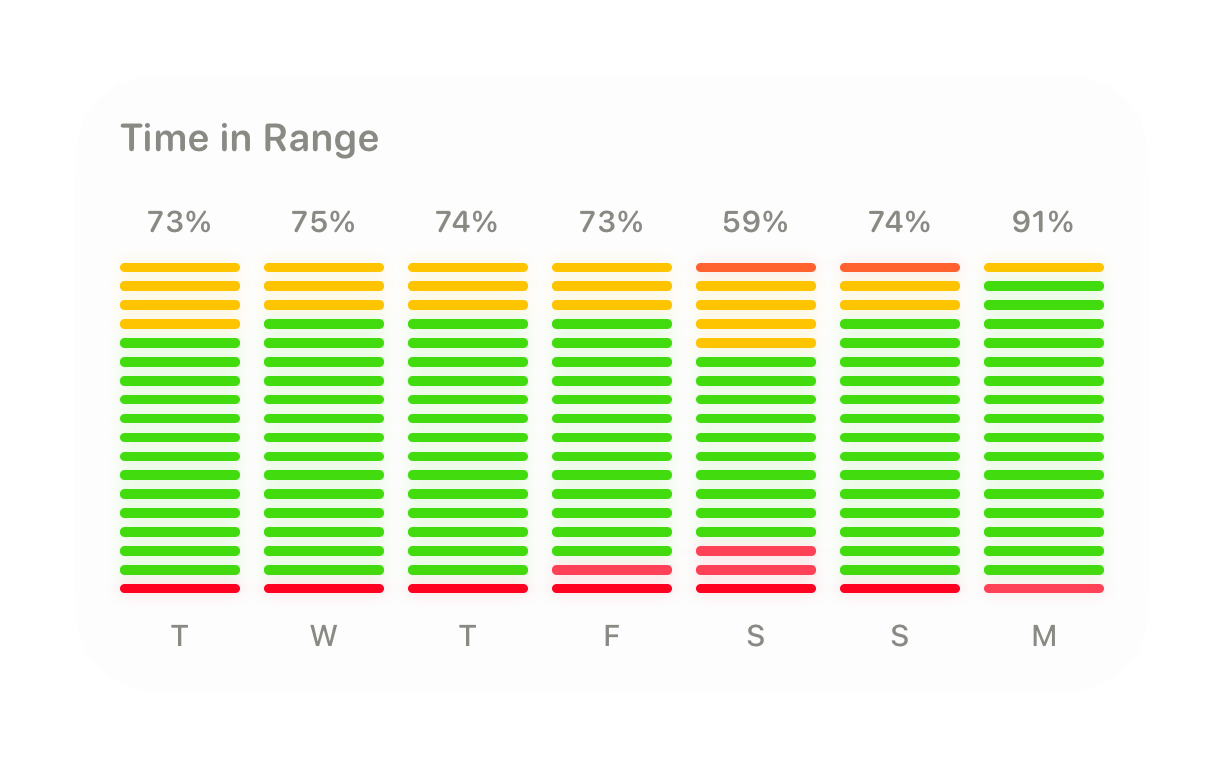
Insights
Time in Range, estimated A1c, variability, and average glucose, calculated from your own readings and explained in plain language. Part of Glynce Plus.
Download
The metrics your care team asks about, calculated from your own readings. Trends are part of Glynce Plus.
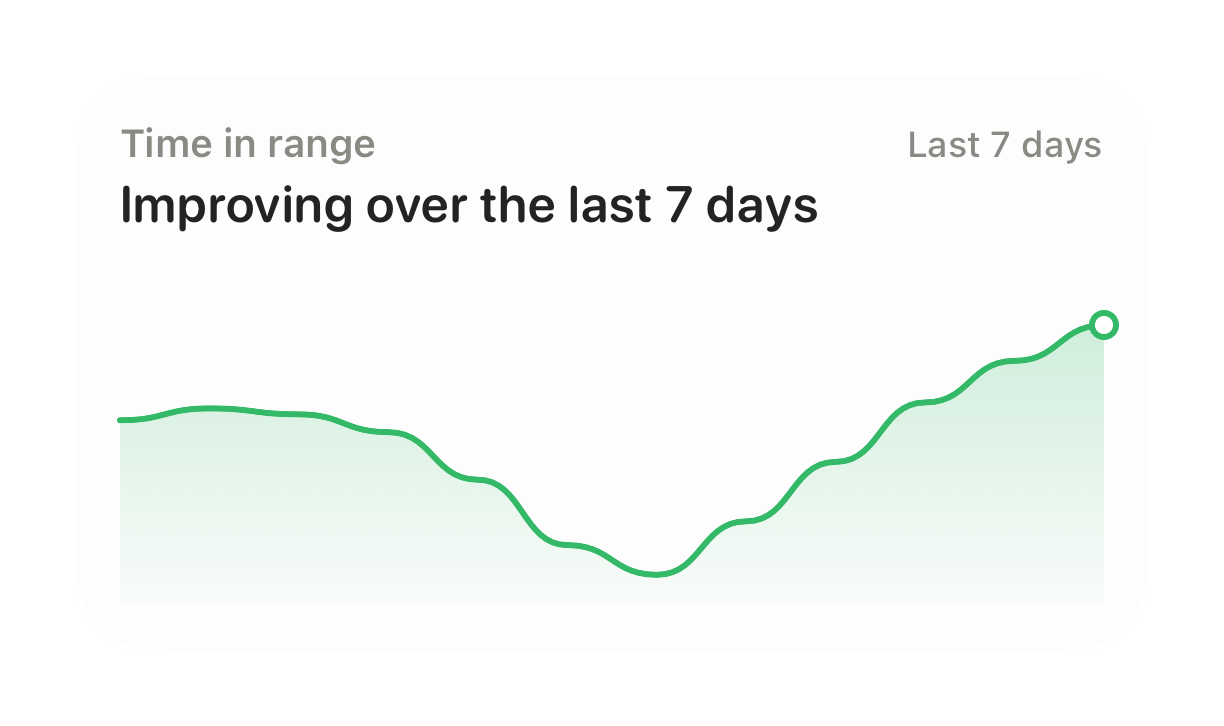
The share of the day your glucose sat inside your target range. The number most clinics now care about more than A1c.
An estimate from your CGM data, also called GMI, so you have a sense of where you are between lab tests instead of waiting three months.
How much you swing, as both a standard deviation and a coefficient of variation. Two people can share an average and have completely different days.
The plain mean across the period. Useful next to variability, misleading on its own.
Your current reading tells you what to do in the next twenty minutes. It cannot tell you whether this month is going better than last.
Every metric can be read over three days, a week, a fortnight, a month, or ninety days. The short windows tell you whether a change you made is working. The long ones tell you whether it stuck.
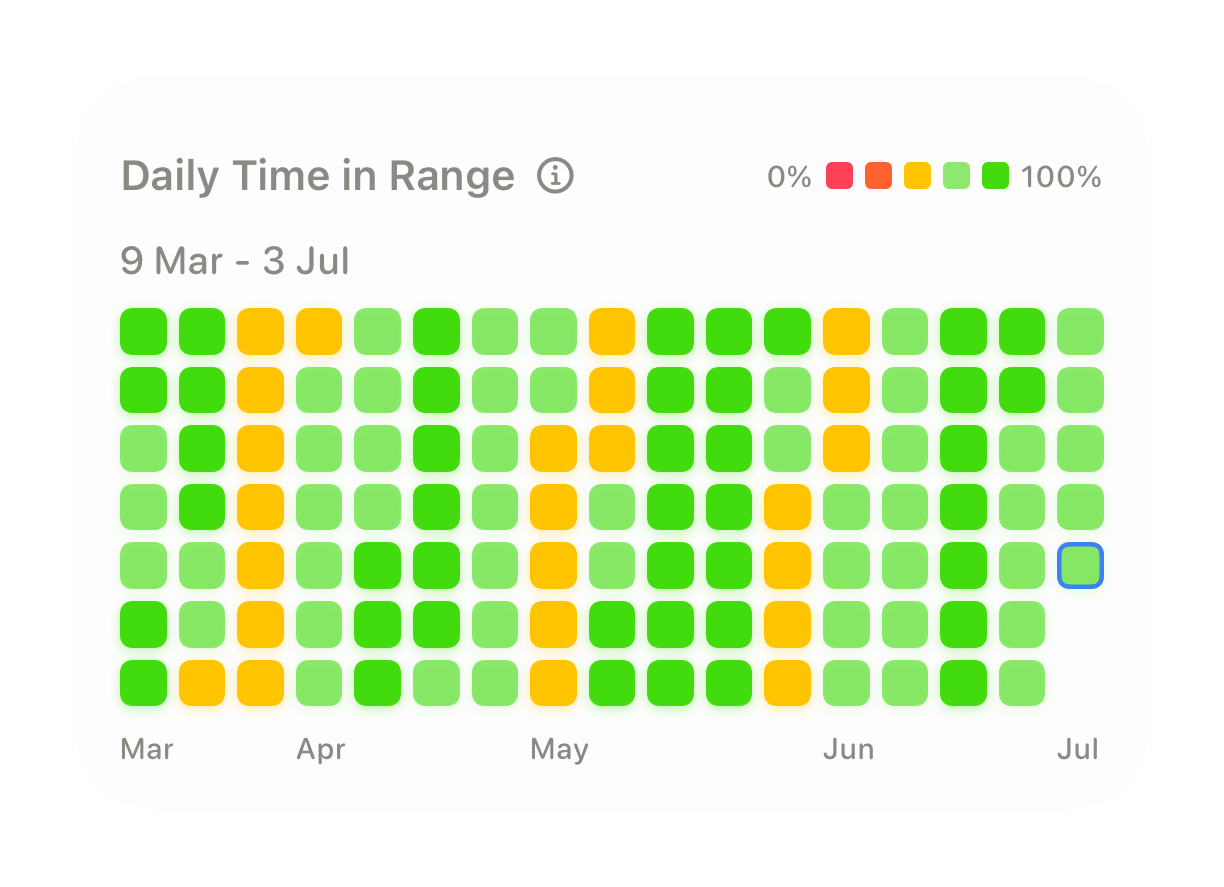
Alongside them, a heatmap lays your Time in Range out day by day across the past months, the way a contributions graph does. Patterns you would never find by scrolling a chart, like every second weekend going sideways, show up as a shape.
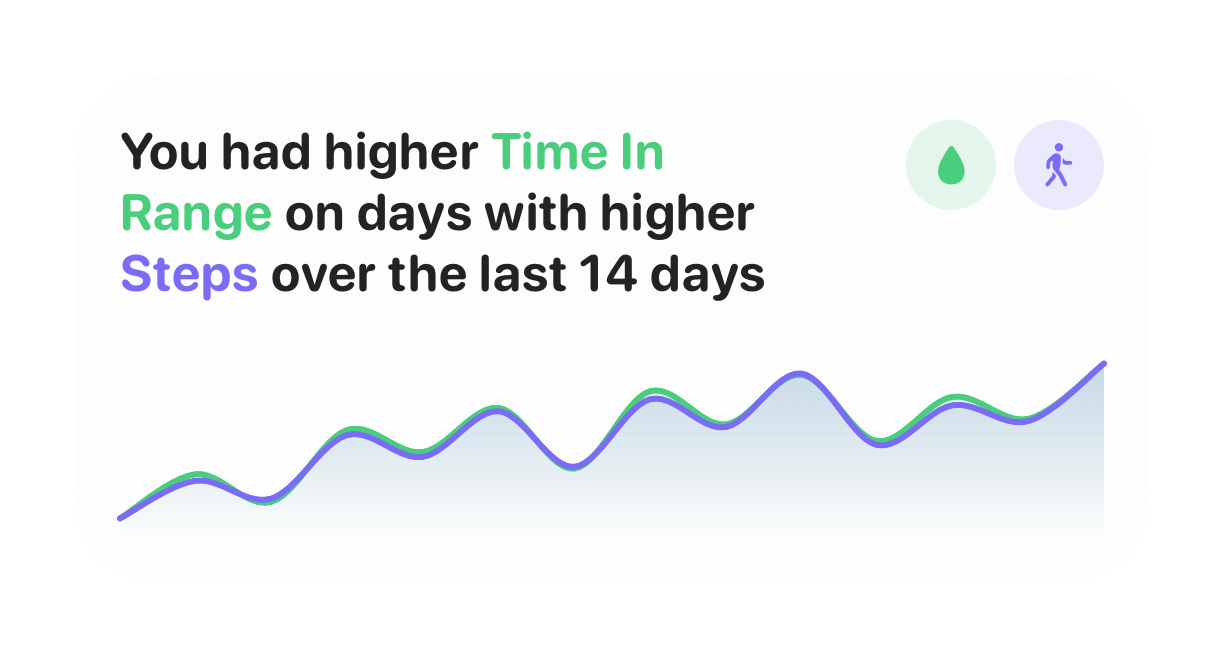
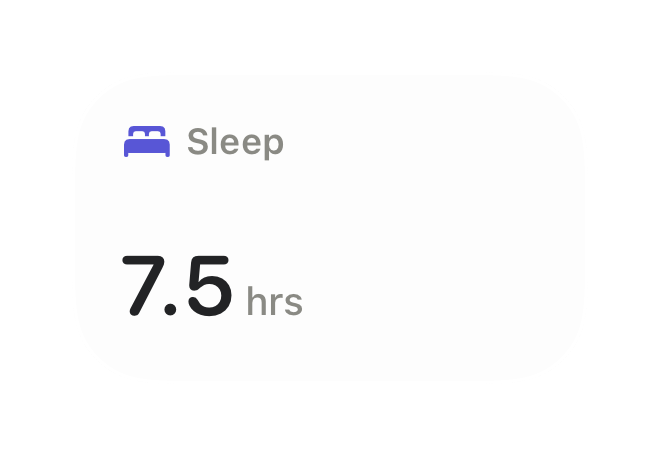
Glucose does not happen in isolation. Glynce reads sleep, resting heart rate, HRV, respiratory rate, wrist temperature, blood oxygen, VO2 max, steps, and your activity rings from Apple Health, and charts each one over a month, six months, or a year.
To be straight about it, these are tracked and trended, not correlated. Glynce will not tell you that a short night caused your morning high. It shows you both, on the same day, and leaves the conclusion to you and your care team.
Glynce builds a multi-page PDF over seven, fourteen, thirty, or ninety days, in the shape a diabetes team already reads. An overview of your key metrics and Time in Range, an ambulatory glucose profile with the usual percentile bands, your daily curves with a log beside them, and a nutrition and activity summary.
You choose which sections to include, then share the file however you like. It is a starting point for a conversation rather than a substitute for one, and every page says so in its footer.
No. Your live glucose and today's chart are free, but the Trends tab, the history beyond today, and the PDF report are part of Glynce Plus.
From your average glucose over the period, using the standard ADA formula. It is also called GMI. Glynce needs at least five days of data before it will show one, and it stays an estimate: a preview of the number your clinician measures in a lab, not a replacement for it.
Variability is how far your glucose swings around its own average. Glynce shows a standard deviation, which is that spread in your own unit, and a coefficient of variation, which expresses the same spread as a percentage of your average so it can be compared across months and across people.
Yes. Glynce generates a PDF over seven, fourteen, thirty, or ninety days containing an overview, an ambulatory glucose profile, your daily curves with a log, and a nutrition and activity summary. You pick the sections and share the file from your phone.
No, and it will not pretend to. Sleep and the other Apple Health metrics are tracked and charted alongside your glucose so you can look at them together, but Glynce does not claim that one caused the other. Working out cause is a conversation for you and your care team.
Free on iPhone
Download